

For mid-market business owners and executives, a profit margin calculator provides a basic formula for top-line health. But a percentage on a screen does not explain why that percentage is shrinking. Most owners make pricing, cost, and margin decisions alone in real time. No one tests whether a declining number comes from pricing, cost inflation, or quietly uncaptured scope until several quarters of margin are already gone. A static calculation tells you what your margins are today. It cannot show you the direction they have been moving, or which decision started the slide.
To defend your margins and grow your profits sustainably, you need to look beyond basic arithmetic. Master the formulas that dictate gross versus net profitability, then track those numbers over time against the decisions that moved them.
The Essential Profit Margin Formulas Every Leader Must Master
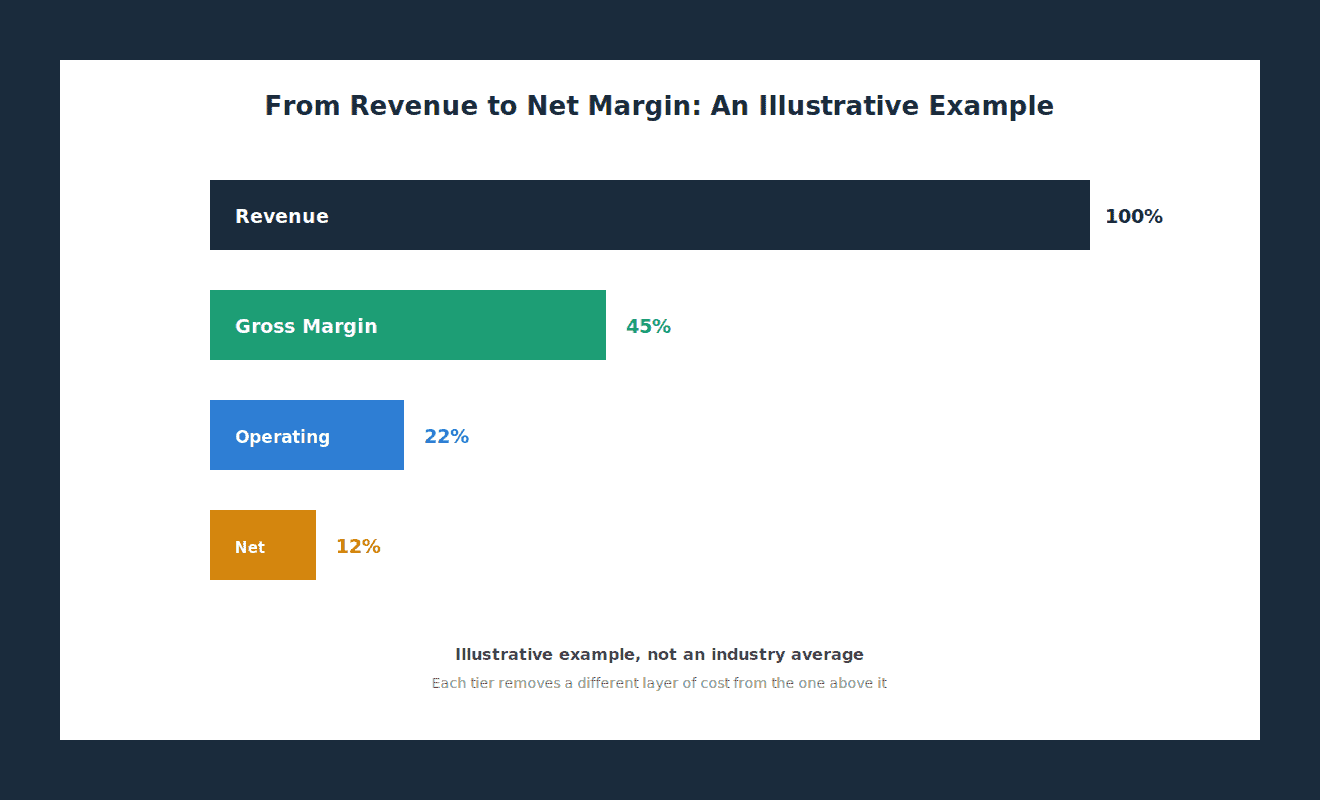
At its core, calculating profit margins requires isolating specific tiers of your income statement. Depending on whether you are assessing unit economics or company-wide performance, you should evaluate three distinct margin metrics:
1. Gross Profit Margin
Gross margin measures the efficiency of your direct production or service delivery before accounting for overhead or administrative costs.
Gross Margin % = (Total Revenue – COGS) ÷ Total Revenue × 100
A declining gross margin indicates that input cost inflation, labor inefficiency, or uncompensated scope creep is eating away at your core unit economics. Understanding the primary margin erosion causes at the delivery stage is essential for maintaining strong gross profitability.
2. Operating Profit Margin
Operating margin expands the lens to include fixed overhead, sales expenses, and administrative costs. This is your EBIT, or earnings before interest and taxes. It is not EBITDA, which adds depreciation and amortization back.
Operating Margin % = Operating Income ÷ Total Revenue × 100
This metric reveals how effectively management controls non-production overhead as revenue scales. If revenue keeps increasing while operating margins shrink, you are in the growth trap, where the business gets bigger and less profitable at the same time.
3. Net Profit Margin
Net margin reflects true bottom-line profitability after deducting all operational costs, interest liabilities, taxes, and non-operating expenses.
Net Margin % = Net Income ÷ Total Revenue × 100
Net margin is what falls to the bottom line. What you actually keep in the bank depends on working capital, capital expenditure, and debt principal, none of which appear in the formula. Reading gross, operating, and net margin together is what pinpoints the problem. A healthy gross margin with a weak net margin points to overhead. Weak at both levels points to delivery costs.
Now Find Your Own Gap
The Profit Gap Analysis takes 2 minutes and 8 inputs to show where your own margin is leaking, using your real numbers instead of a generic formula.
Run the Profit Gap Analysis
Margin Erosion Is a Trend, Not a Snapshot
The word erosion implies movement. A single calculation cannot show movement. You only see erosion when you measure the same three margins, on the same definitions, across four or more consecutive quarters.
That second condition matters more than it sounds. Most owners recalculate margin after the fact, using whatever cost allocation the bookkeeper applied that quarter. When the COGS definition drifts, the trend line turns into noise. Lock the definitions first. Then the movement you are looking at is real.
Once you have four points on a line, a declining gross margin resolves into four separate causes:
- Price: realized price per unit fell through list changes, discounts, or rebates.
- Volume: you sold fewer units, so fixed delivery costs spread across a smaller base.
- Mix: your unit economics never changed. You simply sold more of the low-margin work.
- Cost: input costs rose and you did not pass them through.
Mix is the one that catches owners. Every product line can hold its margin while the blended number falls, purely because the sales team closed more of the cheap work. No calculator can see that. A price, volume, mix, and cost bridge between two periods can, and it is the single most useful margin diagnostic available to a mid-market operator.
Why the Margin Trend Is Hard to See
Owners rarely lack the numbers. They lack the record of what they decided, and when.
The 8% discount approved in March to win a large account does not show up in the Q3 margin report as a discount. It shows up as a slightly worse gross margin, blended together with a freight increase and two underquoted jobs. By the time anyone asks why margins slipped, the reasoning behind the March decision lives in an email thread, if it survived at all.
That gap is what the Econblox Decision Vault closes. It keeps a permanent, searchable record of each decision, organized by project, alongside the reasoning and the numbers you used at the time. When the margin trend moves six months later, the decision that moved it is still there to check. You can see which calls held their economics and which quietly cost you points.
So the discipline is simple. Record the decision when you make it, not when the quarterly report raises the question. A margin trend tells you that something changed. A decision record tells you what.
Why Basic Online Profit Margin Calculators Fail Mid-Market Businesses
Standard web calculators treat margins as static, linear variables. In actual business operations, margin expansion requires active, strategic intervention. Generic calculators fail to capture three critical operational realities:
- Price Elasticity and Volume Trade-offs: Lowering prices to win volume often destroys total margin dollars. At a 40% gross margin, a 10% discount requires a 33% volume increase just to hold gross profit flat. Run that unit math, and understand the economics of discounting, before you adjust your price points.
- Uncaptured Scope Creep: In service and B2B sectors, unbilled custom work can quietly consume 5 to 15 points of a planned gross margin.
- Weak Pricing Discipline: Businesses without structural pricing power are forced to absorb supplier inflation rather than passing price adjustments on to end customers.
Profit Margin Reference Benchmarks by Industry
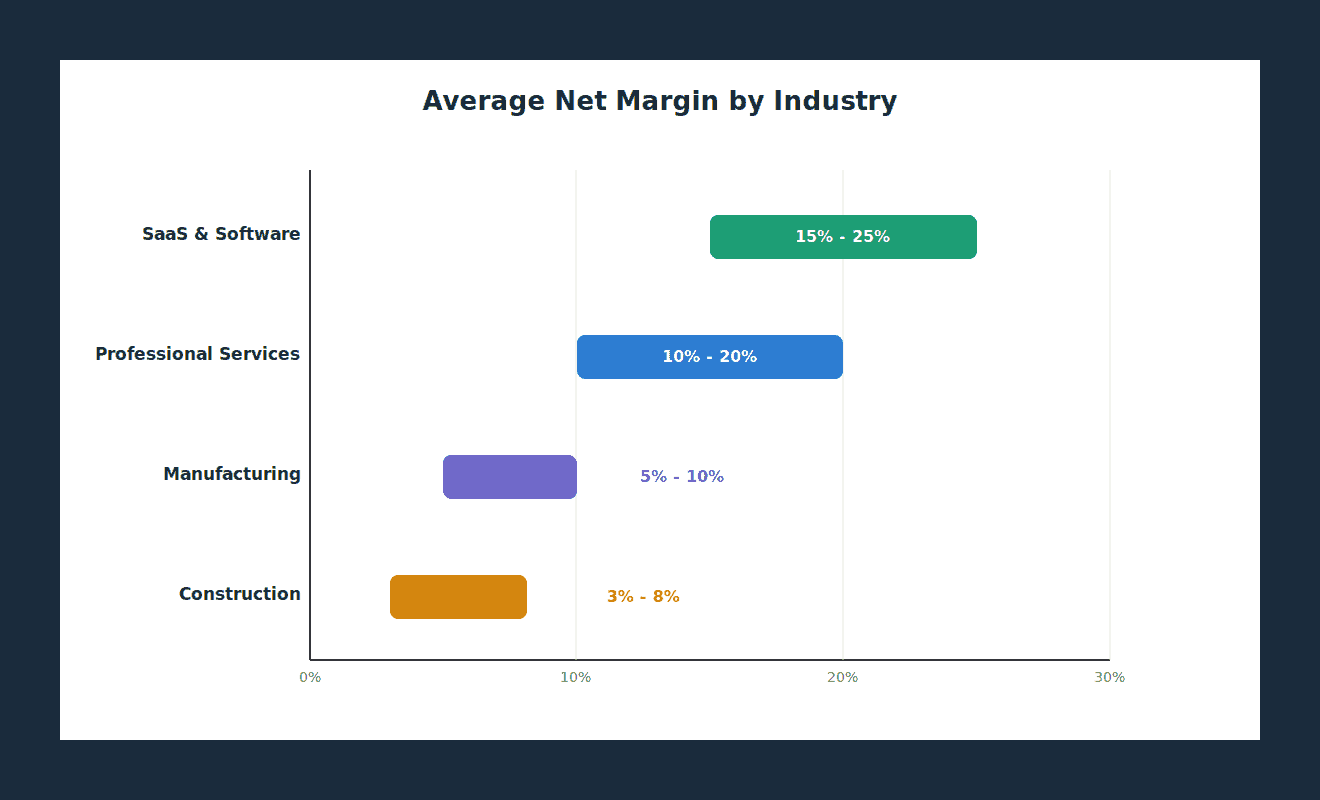
When evaluating your calculation outputs, compare your results against industry benchmarks:
| Industry / Sector | Gross Margin | Net Margin | Primary Margin Expansion Lever |
|---|---|---|---|
| SaaS & Software | 72% | 25% | Customer retention and account expansion |
| Professional & Business Services | 33% – 34% | 6% – 7% | Billable utilization and value-based fee structures |
| Manufacturing & Distribution | 24% – 37% | 4% – 11% | Supply chain optimization and waste reduction |
| Construction & Contracting | 15% – 23% | 6% – 9% | Accurate job costing and change-order discipline |
Source: NYU Stern industry margin dataset (Damodaran), January 2026. Rows used: Software (System and Application); Business and Consumer Services with Information Services; Machinery, Building Materials, Retail Distributors and Packaging; Engineering/Construction with Homebuilding.
Read these as direction, not as a target. They are averages for US publicly traded companies, and scale flatters the bottom line. Privately held mid-market firms usually land below these net margins. Owner compensation, thinner overhead absorption, and a different cost of capital all sit between operating income and net income.
The same dataset puts internet software at roughly 63% gross margin and a net margin near zero, so a growth-stage SaaS business running at breakeven is not broken. Gross margin travels across company sizes far better than net margin does. Compare on gross first, and treat net as directional.
3 Strategic Steps to Expand Your Profit Margins
Once you calculate your current margins, take active steps to protect and expand your bottom line:
- Institutionalize Disciplined Price Increases: Learn how to raise prices without losing customers by tying price adjustments directly to delivered client value and differentiated features.
- Eliminate Unprofitable Product Lines and Accounts: Conduct a quarterly profitability audit to re-evaluate or offload low-margin clients that consume disproportionate operational resources.
- Track the Decision, Not Just the Number: Review margin every quarter against the decisions that shaped it. A structured decision record turns each pricing and cost call into evidence you can test a year later, instead of a memory you argue about.
Therefore, treat a profit margin calculator as the starting line, not the finish. The formula tells you where you stand today. The trend tells you which way you are moving, and the record of your decisions tells you why.
Talk Through Your Margins With an AI Business Advisor
Formulas and benchmarks only get you so far. Model your own pricing, cost, and margin scenarios directly with the Econblox AI Business Advisor, free, no credit card required.
Start Your Free Trial →
 No Credit Card Required For Trial